SNESIM
The 'SNESIM' type prior model utilizes the SNESIM algorithm, as implemented in Fortran available at Stanford/SCRF.
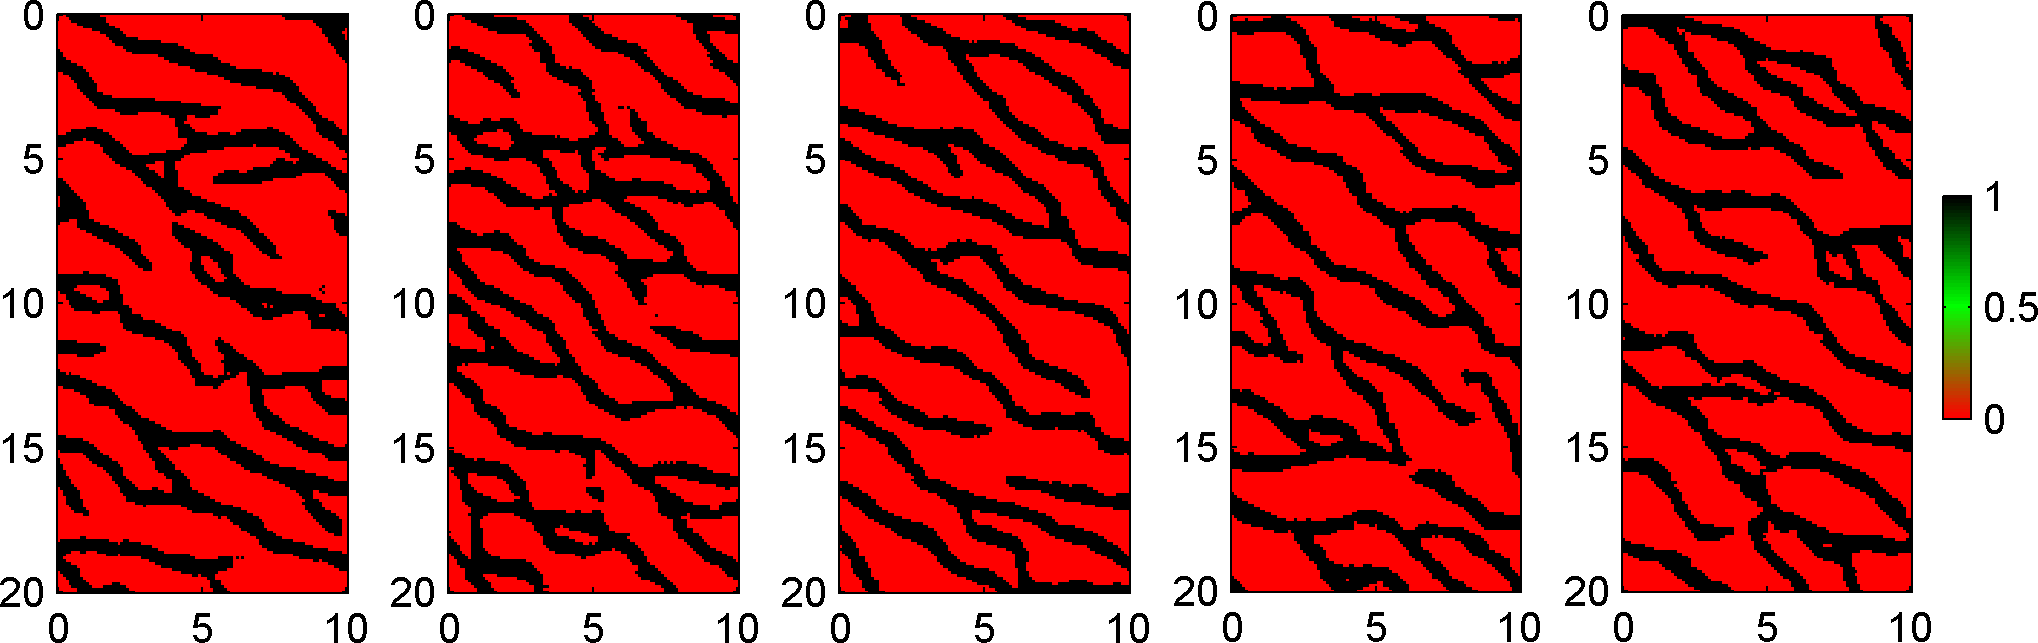
By default a training image (channel structures) from Sebastian Strebelle's PhD theses is used (if no training image is specified). A simple 2D type SNESIM prior model can be defined using the following code:
ip=1;
prior{ip}.type='SNESIM';
prior{ip}.x=[0:.1:10]; % X array
prior{ip}.y=[0:.1:20]; % Y array
and 5 realizations from this prior can be visualized using
for i=1:5;
    m=sippi_prior(prior);
    subplot(1,5,i);
    imagesc(prior{1}.x,prior{1}.y,m{1});axis image
end
Note that the training image is always assumed to have the same units as the prior model, so in this case each pixel in the training image is assumed to be separated by a distance '0.1'.
Optionally 'scaling' and 'rotation' of the training image can be set. To scale the training image by 0.7 (i.e., structures will appear 30% smaller) and rotate the training 30 degrees from north use
ip=1;
prior{ip}.type='SNESIM';
prior{ip}.x=[0:.1:10]; % X array
prior{ip}.y=[0:.1:20]; % Y array
prior{ip}.scaling=.7;
prior{ip}.rotation=30;
Custom training image
A custom training image can be set using the ti field, which must be either a 2D or 3D matrix.
% create TI from image
EXAMPLE EXAMPLE

% setup the prior
ip=1;
prior{ip}.type='SNESIM';
prior{ip}.x=[0:.1:10]; % X array
prior{ip}.y=[0:.1:20]; % Y array
prior{ip}.ti=ti;
Note that the training image MUST consist of integer index values starting from 0 (i.e. '0', '1', '2', ...).
Complete customization
If the prior structure is returned from sippi_prior using
[m,prior]=sippi_prior(prior);
then an XML structure prior{1}.S.XML will be available. This allows a complete customization of all settings available in SGeMS. For example, the different realizations, using 1, 2, and 3 multiple grids can be obtained using
ip=1;
prior{ip}.type='SNESIM';
prior{ip}.x=[0:.1:10]; % X array
prior{ip}.y=[0:.1:20]; % Y array
[m,prior]=sippi_prior(prior);
for i=1:5;
    prior{ip}.S.XML.parameters.Nb_Multigrids_ADVANCED.value=i;
    subplot(1,3,5);
    imagesc(prior{1}.x,prior{1}.y,m{1});axis image
end
